30-Day Dating Playbook — Data-Driven Profile Wins
Published on 1/30/2026 • 9 min read
I decided to treat my dating profile like a product launch. One afternoon I booted up my app metrics, brewed a big cup of coffee, and wrote a one-line mission: make every change measurable, then iterate fast. For 30 days I swapped photos, tested two-version bios, and tracked tiny conversation signals most people ignore. The result wasn’t instant magic, but a predictable uptick—better matches, sharper conversations, and two in-person dates worth the effort.
If you want a playbook you can actually follow (not just a list of tips), this 30-day plan is for you. It’s built around simple metrics, quick experiments, and daily tasks that fit into a busy life. By the end you’ll know which photos and words work for you, and you’ll have a spreadsheet showing what to double down on. I’ve included exact Google Sheet formulas, a CSV you can paste, sample sizes, and a short failure story to help you avoid common mistakes.
Why a 30-day, metric-driven approach works
Most generic dating advice tells you to “take better photos” or “be yourself.” That’s true but vague. I treated my profile as an experiment: change one variable, measure it, and give it time. That prevents the classic trap of changing many things at once and chasing total matches instead of real conversation quality.
This plan zeroes in on signals that predict real dates: reply rate, early message quality, and who suggests meeting. We also track photo CTR (how often a photo leads someone to tap into your profile) — a metric often overlooked but incredibly useful for picking the right lead image.
Quick truth: matches are vanity. Replies and actual dates come from the right conversations.
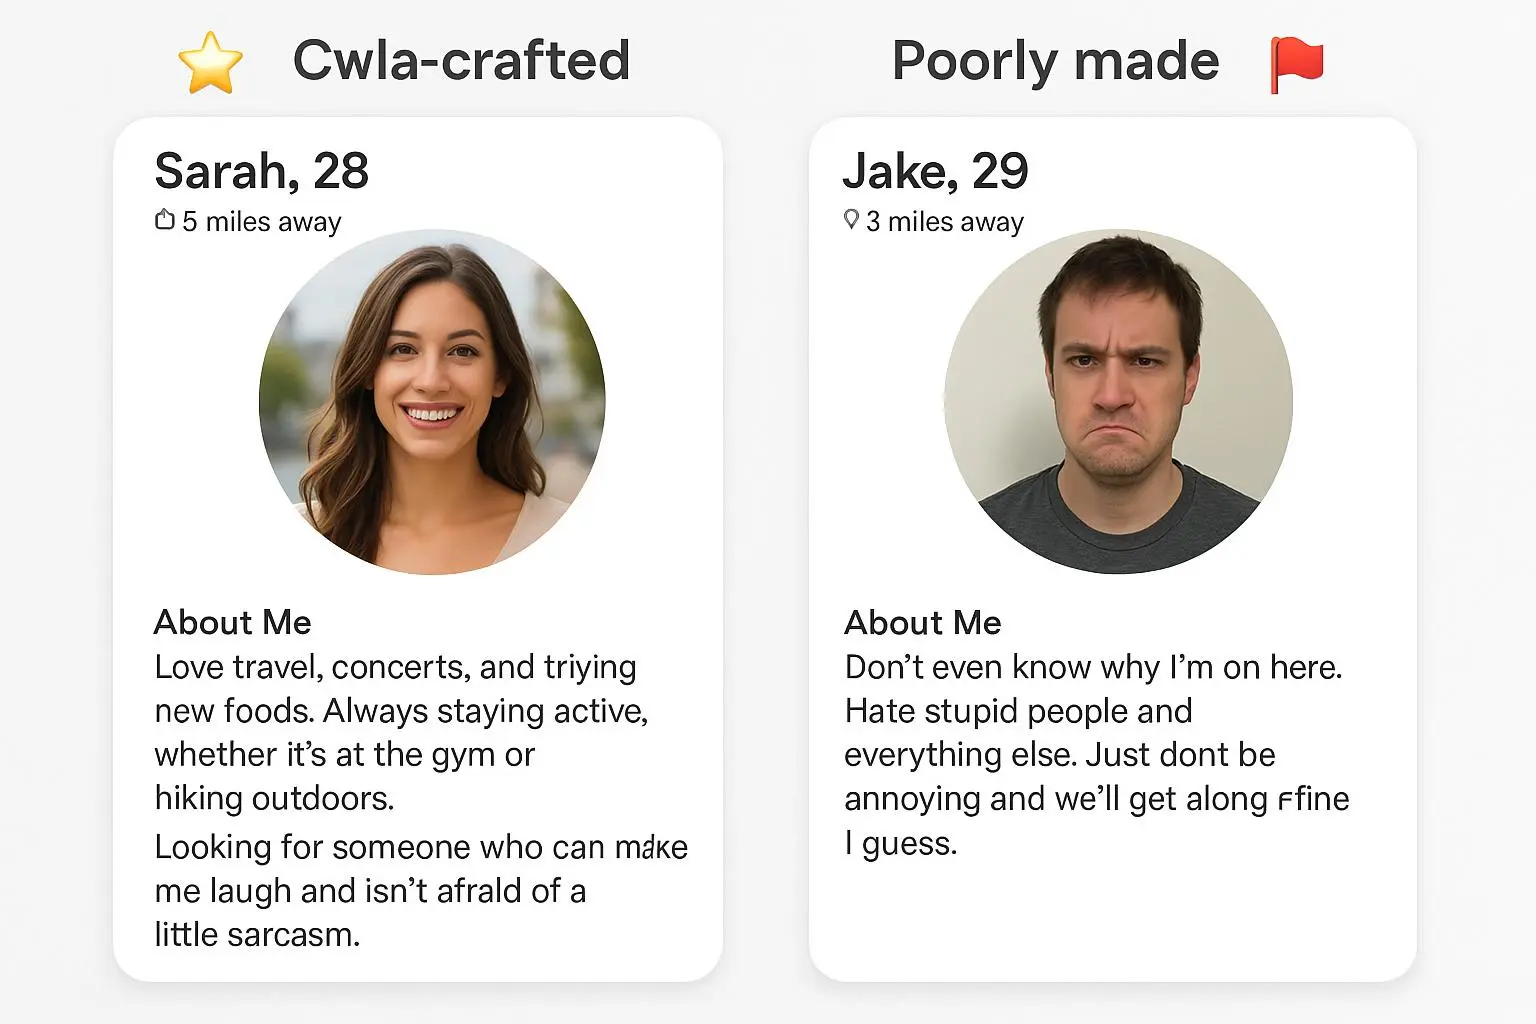
Micro-moment: I opened my profile after a quiet spell and thought, “This doesn’t even look like me.” The lighting was flat, my posture stiff, and my bio sounded generic. Ten minutes with a few targeted tweaks and a fresh photo set changed the vibe—immediately, text conversations felt warmer and more eager to meet.

Metrics you must track (and exact formulas)
If you track one thing, track reply rate. Below are core metrics with formulas you can drop into the sheet:
- Match rate = matches / right_swipes (or likes)
- Reply rate = replies_received / messages_sent_to_matches
- Ask-out rate = ask_out_count / conversations_tracked
- Photo CTR (estimate) = profile_taps / impressions (or sightings)
- Quality-signal rate = quality_signals_count / matches_sampled
Example Google Sheet formulas (paste into your sheet):
- Match rate (%) in cell E2: =IF(B2=0,0,C2/B2)
- Reply rate (%) in cell H2: =IF(F2=0,0,G2/F2)
- Ask-out rate (%) in cell K2: =IF(J2=0,0,L2/J2)
- Photo CTR (per 100 impressions) in cell M2: =IF(N2=0,0,(O2/N2)*100)
Use the formulas above to build a simple Google Sheet tracker, then make a copy before you start testing.
Tools & setup: simple, no-fuss tracking
You don’t need fancy software. I used a Google Sheet template with three sections: daily aggregate metrics, experiment log, and notes on conversation quality. Columns I logged:
- Date range
- App (Hinge/Tinder/Bumble) and app version
- Right-swipes sent
- Matches
- Match rate (%)
- Messages sent to matches
- Replies received
- Reply rate (%)
- Photo lead (A/B name)
- Photo CTR estimate (profile taps per sightings)
- Quality signals count (messaged first, replies <24h, >30 words)
- Ask-out count
- Notes / qualitative observations
If you want to replicate my sheet quickly, paste this CSV into a new sheet (first row = headers):
Date Range,App,App Version,Right Swipes,Matches,Messages Sent,Replies Received,Photo Lead,Profile Taps,Impressions,Quality Signals,Ask Outs,Notes 2025-03-01 to 2025-03-05,Hinge,7.3,120,10,9,3,A,18,300,2,0,Baseline 2025-03-06 to 2025-03-10,Hinge,7.3,130,11,10,4,B,22,320,5,1,Photo test
Daily rhythm (how I stayed consistent)
Short, focused tasks kept momentum without turning this into a second job. My routine took 10–20 minutes per day:
- Days 1–5: Audit & baseline. Record current metrics and fix obvious lighting issues.
- Days 6–10: Photo A/B test. Swap lead photos and log changes.
- Days 11–15: Bio split test. Try two bios and measure reply quality.
- Days 16–20: Messaging experiments. Test 3 opening lines with similar cohorts.
- Days 21–25: Signal prioritization. Filter conversations using quality signals.
- Days 26–30: Iterate & lock in winners. Update profile with best photo/bio combo and plan the next month.
Every day: 5 minutes to check the sheet, 10 minutes to make changes or send messages. Short bursts prevent burnout.
Running photo A/B tests (simple and fast)
You don’t need complex split-testing. Alternate lead photos in controlled windows and compare metrics. Minimum window: 48 hours; 72 hours reduces variance.
How I ran mine:
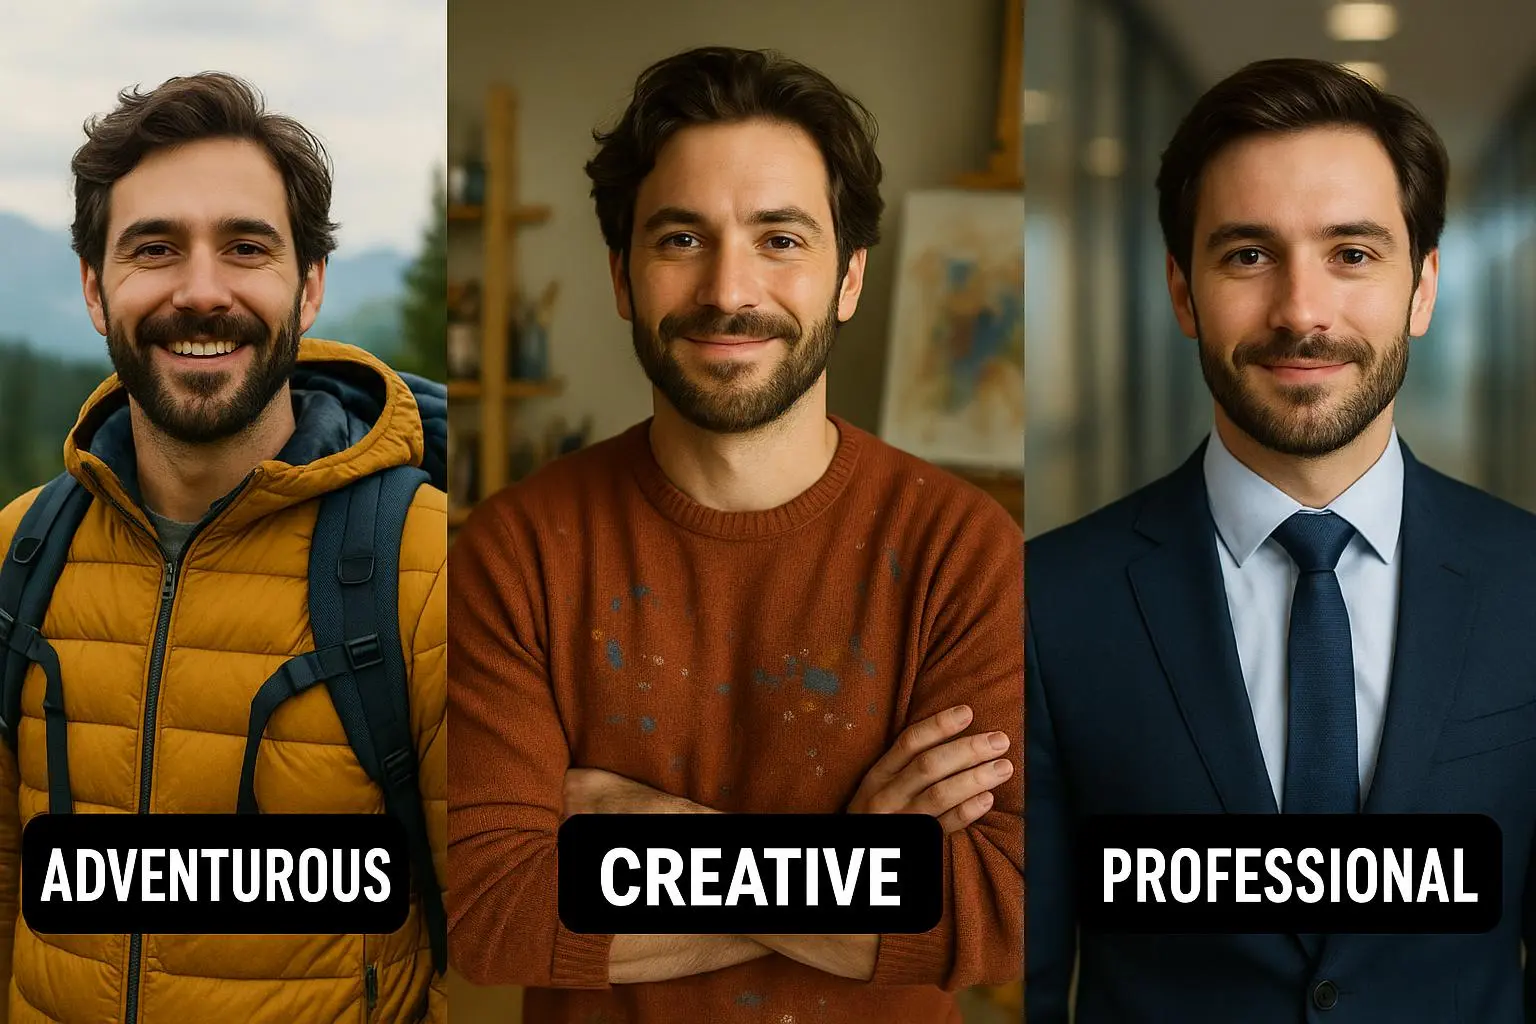
- Pick two lead photos (A and B) with clearly different framing/style.
- Test window: 48–72 hours per photo, repeat across both weekdays and weekend slots.
- Log matches, match rate, and taps for each window.
Example outcome (sample size notes): Photo A — 300 impressions, 25 taps, 10 matches; Photo B — 320 impressions, 22 taps, 8 matches. With these sizes expect noisy but directional results — aim for 200+ impressions per window to reach reasonable confidence.
What surprised me: photos that generated more matches didn’t always create better conversations. One candid park photo drove fewer matches but far higher reply and ask-out rates. That’s why track both match and reply rates.
Bio experiments that actually move the needle
Bios set expectations and give conversation fodder. I ran a two-version test: “Hobby forward” vs “Values + ask.” I controlled messaging by sending the same openers across both cohorts.
- Hobby forward: short, active lines about hiking, cooking, playlists.
- Values + ask: two sentences about what I care about + a question prompt (e.g., “Tell me the best playlist for a rainy Wednesday”).
Result (my sample): Values + ask increased reply rate ~15% and produced longer first replies. Sample size: ~90 matches across tests; effect size held after repeating the test.
Bio tips that worked:
- Replace passive statements with specific scenes (e.g., “I’ll binge foreign thrillers on Sunday”).
- End with a question or micro-challenge to invite replies.
- Keep it 2–3 short sentences.
Messaging experiments: what to test and why
I tested openers across similar match groups: playful observation, direct compliment, and a profile-based question.
- Playful: light joke tied to a photo.
- Direct compliment: sincere, specific compliment.
- Profile question: a curiosity hook about a listed hobby.
Result: the profile question won for reply rate and conversation length. Playful openers were hit-or-miss; compliments got polite replies but seldom led to ask-outs.
Interpreting results: what to prioritize
When metrics conflict, prioritize the ones closest to dates. My hierarchy:
- Ask-out rate — did people agree to meet? Double down.
- Reply rate + conversation quality — are replies meaningful and timely?
- Photo CTR and match rate — improve top-of-funnel but don’t chase volume alone.
If a photo increases match rate but drops ask-out rate, either pair it with a different bio/messaging style or drop it. A flattering headshot can attract attention but set a tone that makes conversations shallow.
Quick wins you can do today
- Replace your lead photo with a high-contrast smiling headshot in natural light; crop tight if needed.
- Add one question at the end of your bio.
- Remove photos where you’re obscured (poor light, sunglasses, heavy filters).
- Change your opening line to a profile-based question for the next 20 conversations.
Example experiments (simplified, real-style numbers)
- Photo Test 1 (6–10): A matched rate 8.2% / reply 28% — B matched 6.4% / reply 41% — Winner: B (quality)
- Bio Test 1 (11–15): Hobby reply 22% / ask-out 4% — Values+Ask reply 37% / ask-out 7% — Winner: Values+Ask
- Messaging Test (16–20): Question reply 45% / long replies 30% — Winner: Question
From these tests I cropped a new lead photo (B), switched to the Values+Ask bio, and standardized profile questions as openers. Ask-out rate rose from ~3% to ~9% in two weeks.
The human + data advantage
Data helps you cut through guesswork without turning dating into a chore. You’re still you—just with clearer signals on what actually moves conversations forward.
Your personality is unique. Your humor is real. Your interests are genuine. The playbook simply helps make sure your photos and words aren’t hiding all of that behind noise.
Ready to start?
If you’re ready to test and learn, download the tracker, pick one variable to change, and run a 48–72 hour window. Keep notes, compare, and iterate. By the end of 30 days you’ll see which photos and prompts actually drive dates.
Tip: keep your experiments small and focused. One change at a time reduces guesswork and speeds up learning.
Real-world references
- Strategy Journaling (Dating)[1]
- Hey Saturday (30-day dating challenge ideas)[2]
- Strategy Journaling (30-day dating challenge product)[3]
- WHOP (30-day dating app playbook)[4]
References
Footnotes
-
Strategy Journaling. (2025). 30-day dating challenge. Publication. ↩
-
Hey Saturday. (2023). 30-day dating challenge ideas that will transform your dating life. Publication. ↩
-
Strategy Journaling. (2024). 30 day dating challenge. Publication. ↩
-
WHOP. (2023). 30-day dating app playbook. Publication. ↩
Try the tools
Put this advice into action
Use the matching Rizzman tools to turn the advice into a stronger profile, opener, or reply.
Dating Profile Optimization: Complete Guide to Getting More Matches (2026)
Step-by-step dating profile optimization with photo strategy, AI photo rating, bio formulas, and Tinder, Hinge, and Bumble tactics for better matches.